Feature: Fire can make hardwood stands enduring
As one significant boreal research project (the NASA Arctic Boreal Variability Experiment) winds down, another important research collaboration is winding up, thanks to hard work by a group of scientists in Bonanza Creek Long-Term Ecological Research unit (BNZ-LTER). Both projects have tackled important fire science and management issues in Alaska. Although BNZ-LTER grew from the Bonanza Creek Experimental Forest (beginning in the 1980’s) and Caribou-Poker Creek Watershed, it’s work now expands across Alaska and western Canada and includes collaborating researchers from many locations, but especially University of Alaska and Northern Arizona University. BNZ-LTER also welcomes broad collaboration from land and resource managers and community stakeholders.
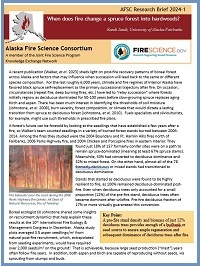
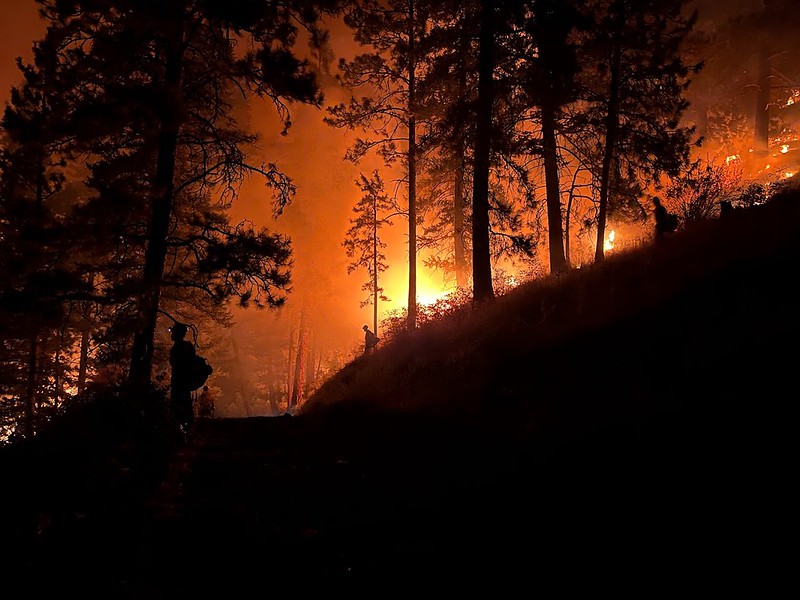
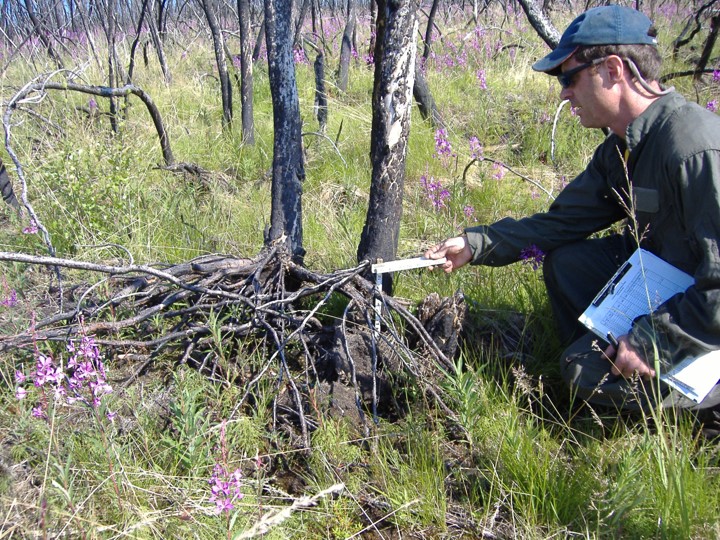
Research at the BNZ-LTER has always had a strong wildfire component. Dr Michelle Mack leads the unit as their Principal Investigator, as well as heading Northern Arizona University’s (NAU) Plant and Ecosystem Ecology Research Lab. In May 2023, Dr. Mack and her team were awarded a renewed grant of $7.6 m from the National Science Foundation for support through 2029. The project, titled Changing Disturbances, Ecological Legacies, and the Future of the Alaskan Boreal Forest, has several subtopics, including a Wildfire Working Group led by Dr. Xanthe Walker (NAU). The wildfire group is studying direct and indirect effects of fire, such as seedling re-establishment, effect on soil microbes, overwintered fires and stream chemistry. They are also studying fire management activities like fuel breaks. One recent publication by Walker, Mack, Johnstone, and others is highlighted in our latest Research Brief: When does fire change a spruce forest into hardwoods? The paper discusses what has been learned from the LTER’s extensive network of post-fire forest plots on drivers and thresholds of stand-type conversions—a hot topic for a number of management applications.