A recent paper by Lucas Diaz, et al. (2026) builds upon previous work to more accurately estimate the carbon impact of southwest Alaska tundra fires. When Moubarak, et al. 2023 studied the after-effects of the 2015 tundra fires, they found that 910,000 metric tons of carbon were released in emissions alone from the 134,000 acres of fires in that region. More recently, Diaz’ team studied the 2022 Apoon Pass/East Fork fires in southwest Alaska using similar methods to tie field measurements to satellite-generated burn severity metrics. Just these two fires in 2022 released the carbon equivalent of 6,876,178 barrels of oil, not counting any post-fire release due to permafrost thaw, nor the carbon footprint of the fire suppression efforts. Tussock tundra emitted an average of 1.59 ± 0.55 kg C m−2 during combustion. In 2022 burn depth averaged 7 cm, so only 11% of the total pre-fire carbon stock was consumed–mostly duff organic soil. These estimates compare favorably with Moubarak’s earlier findings of 1.68 kg C m−2 for the 2015 tundra fires. Moubarak further calculated that those fires would have a warming impact on the atmosphere for about 80 years, given the long residence time of CO2 in the atmosphere. Links to these Open Access articles are below:
Reconnaissance flight June 10, 2022, East Fork Fire in southwest Alaska. Photo: Justin Johansen.
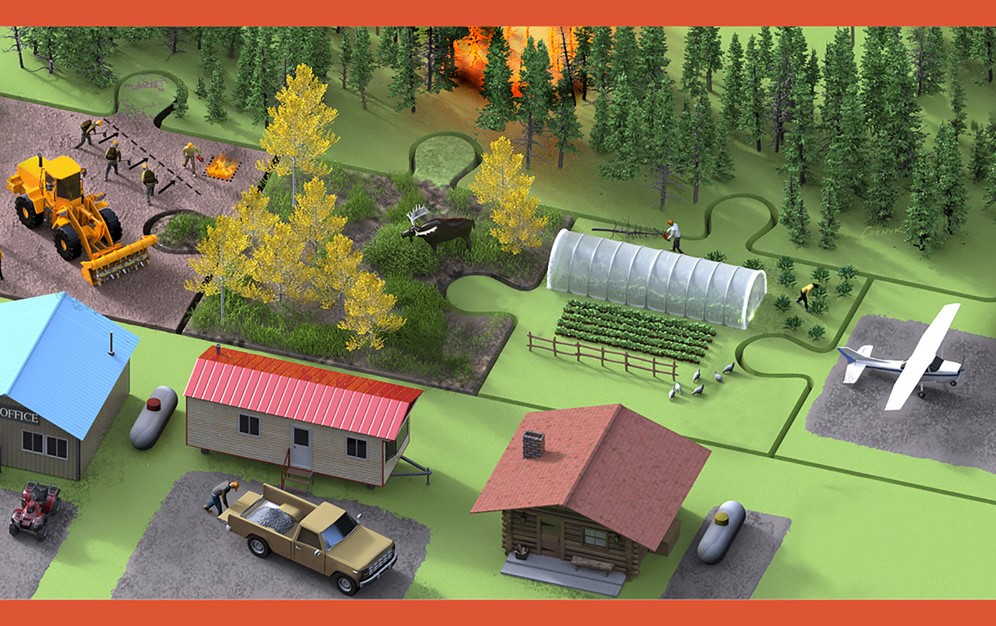
Alaskans know we must live with fire. A new open-access article in iScience synthesizes recent fuel break research from Alaska and Yukon, drawing on input from rural community representatives and scientists alike. The study presents a compelling case: fuel breaks designed with “co-benefits” can add ecological and socio-economic value while increasing social acceptance. The research highlights opportunities to move beyond traditional fuel break approaches toward more adaptive and ecologically informed designs. These innovations include tailoring fuel breaks to local vegetation, integrating them with natural landscape features, and aligning placement with suppression and community protection goals.
Citation:Link, NT; JF Johnstone, XJ Walker, F Amundsen, HK Berrios, L Bibeau, K Cooley, AC Erickson, C Johnston, JM Little, N Lowjewski, AD Perrin, CA Phillips, S Potter, DC Rees, LB Saperstein, JE Schmidt, EE Sousa, KV Spellman, A Spring, and MC Mack. 2025.Mitigating increasing wildfire risk through fuel break innovations.iScience. Open Access.
Image credit:Victor Leshyk, Center for Ecosystem Science and Society, Northern Arizona University
Wildfires are becoming larger and more severe as the climate shifts in the far north. Fuel breaks are a tool to proactively mitigate risk, but they are expensive, require maintenance, and come with side effects that are sometimes unwelcome to locals. Is there a better path forward?
TheFuel Breaks with Benefits project addresses this question, exploring benefits to communities and ecosystems that could make fuel break planning more effective and appealing. The project established a network of northern experts from many knowledge systems and sectors in Alaska, Yukon, British Columbia, and Northwest Territories to assess opportunities for developing fuel reduction treatments with sustainable social-ecological benefits in boreal forests. The authors emphasize that fuel breaks are not a standalone solution—they are most effective when combined with broader wildfire management strategies, including land-use planning, community preparedness, and fire-smart development practices.
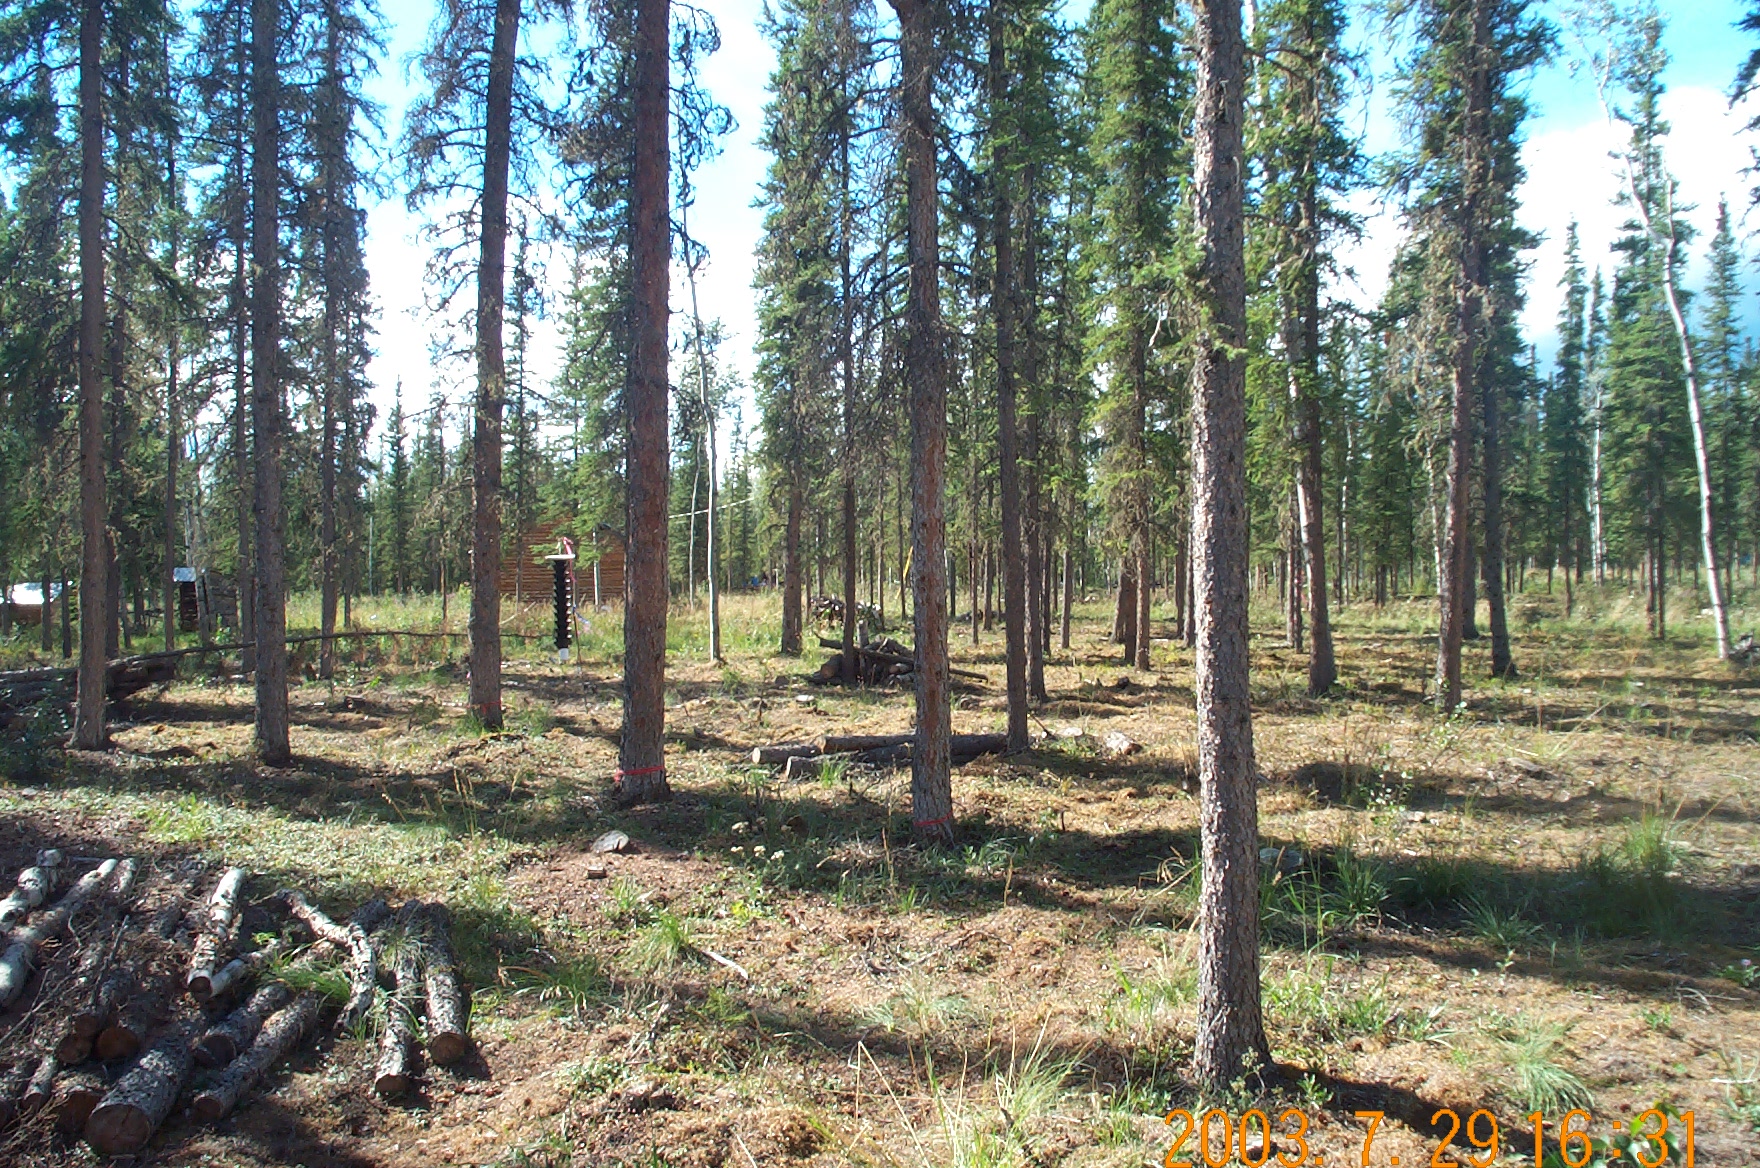
A group of prominent researchers just analyzed data from a large number of burned field sites in Alaska, collected from 2021-2023. The Bonanza Creek Long-Term Ecological Research program at UAF has been funded by the National Science Foundation since 1987 and they have established an impressive network of fire effects plots across interior Alaska. For this analysis on the fate of stored carbon they examined 555 recently (within 7 years) burned plots contained in 31 separate fires across diverse boreal forests, with pre-burn stand ages ranging from 11-254 years. Including the most recent burn, 26 of the sites burned 3 times according to fire records and ecological data.
The analysis indicated that increasing fire frequency and reburning will significantly reduce C storage capacity through progressive consumption of more biomass (mainly duff) with subsequent fire events, as well as shift forested toward non-forested landscapes. Part of the C loss results from the second fire consuming the fallen burned trees from the previous fire. Under the unique conditions that prevail in the boreal landscape, these logs are typically overgrown and buried by moss in a couple decades. There, the cold, acidic environment slows decay so that this wood can be preserved for centuries, but when fire returns to the site quickly the woody debris is consumed before it can be buried in the “bank”.
In short, a recovery period of < 70 years between fire events is not sufficient to reaccumulate C stores in the forest floor between fires and makes it likely that legacy C will be lost with each subsequent fire.
The Alaska Wildland Fire Coordinating Group, representing agencies and land managers involved in managing wildfire has a Fire Research and Applications Committee (FRDAC). Periodically, the committee surveys members and collaborators to see what they consider to be the most important current areas of wildland fire research in the Alaska region. Science providers, in particular, may be interested in this management perspective on research. At last week’s interagency Fall Fire Review, committee chair Jennifer McMillan discussed top-ranked categories of fire effects, fuel treatments, and environmental/land cover change identified by the survey. For example, AWFCG members expressed interest in more research into fire effects on moose/caribou populations, subsistence lifestyles, migration patterns and berry production. For fuel treatments, the areas identified were treatment longevity and effectiveness, maintenance, and biodiversity and habitat responses. Expanded briefs (with citations) on 3 critical research gaps are located on our partner page for FRDAC: https://www.frames.gov/afsc/partners/frdac/research-needs
Many of you will recall the work Badola and Panda have been doing at UAF to test development of low-cost, detailed vegetation maps for boreal Alaska using widely available Sentinel-2 satellite data. Fire managers challenged Anushree Badola (for her PhD work) to make fuels maps that were more accurate than LANDFIRE and better separated black spruce from mixed and deciduous forest types. That work (and her doctorate) was completed last year, and indeed, for the interior Alaska testing site, they appear to be twice as accurate as LANDFIRE at a 30m resolution and do a good job of distinguishing forest types. But did you know that she has made those maps (which cover most of Alaska with the exception of the western end of the Seward Peninsula and the North Slope) available for free download? All is explained succinctly in her STORYMAP and there is also a 2-minute video refresher by Anushree about the project, which was sponsored by National Science Foundation grants and the State of Alaska, with lots of input from the fire management community. Here’s a screenshot from the Storymap as a teaser!
As boreal and arctic ecosystems respond to warming climate, a key question is: will Alaskan landscapes become wetter or drier after fire? Previous studies have shown that, at least for a few years post-fire, organic soil duff has higher moisture content compared to controls, both in boreal forest (Hinzman et al. 2000, Potter & Hugny, 2020) and tundra (Liljedahl, et al. 2007). Liljedahl noted that denser deep organic duff layers remaining after a Seward Peninsula fire had a relatively larger surface area per volume and different pore shape, maybe making them better at retaining water than the pre-burn fluffier upper layers. Yet, over the long term, burn scars tend to become better drained and drier. Hinzman et al. (2000) sampled old burns up to 50 years old and noted “severely burned sites have progressively become drier and warmer resulting in major changes to the vegetation type and soil structure.” What are the drivers of these changes?
Wes Schaefer photo of flux tower on UAF campus. UAF EPSCoR Evapotranspiration Project.
In a recent study, Thunberg et al. 2021 studied factors that drive wetting (precipitation) vs. those that drive drying (evaporation and plant transpiration). Solar radiation speeds evapotranspiration (ET) and relative humidity (RH) slows it down. Thunberg used flux tower data from stations between Fairbanks and Utqiagvik (Barrow) including burnscars from 2004 and 2007. The towers measure greenhouse gas and water fluxes between the land and air. Her study showed ET increased after fire, which could (independent of other factors) indicate a trend toward surface drying. Increased ET was pronounced at a North Slope tundra fire in early years and remained detectable for about 8 years post-fire. ET at Poker Flats forest burn site also exceeded that of an adjacent unburned site during 5/6 years studied. Interestingly, Rocha et al. (2011) linked the early increases in ET at the Anaktuvuk River tundra fire to an increase in evaporation from loss of the spongy moss and organic duff, resulting in surface water pooling and increased soil temperatures. Overall, the ET at forest sites seems to be strongly influenced by relative humidity while ET at tundra sites depends more strongly on air temperature.
Conclusion: Evaporation and transpiration are both important influences on soil moisture budget which tend to increase in young burns, but may be moderated by influences of soil structure, microtopography, and subsurface ice-melt.
New data compiled in NOAA’s 2024 Arctic Report card illuminates the delicate balance between boreal/arctic regions production of carbon dioxide (especially fire smoke and microbial respiration) and it’s uptake (by photosynthesizing vegetation). This balance is sensitive to ambient temperature, and of course is influenced in various ways by wildfire. Slowing down the atmospheric increase in CO2 from burning fossil fuels has taken on some urgency as we see more and more adverse impacts from warmer atmosphere and oceans due to its greenhouse effects. Land management and fire management may have a role to play, especially as we race to develop alternative energy sources. Take a look at this well-illustrated 8-p summary to bring yourself up to speed with what’s happening with carbon in the north country. Link to the report: https://doi.org/10.25923/0gpp-mn10
“When including wildfire emissions, the Arctic tundra region has shifted to a carbon dioxide (CO2) source and is a consistent methane (CH4) source.” (Natali et al. 2024, NOAA Technical Report OAR ARC ; 24-11)
Photo by R. Reanier: Anaktuvuk R Fire, July 14, 2007
A recent study headed by the University of Washington is catching national media attention currently as it points to a connection between exposure to wildfire smoke and dementia in older adults from a large study in California. One new advance is the ability to distinguish between ambient wildfire smoke vs. other types of fine particulate matter (PM2.5) exposure. Although the team’s publication in PubMed is pay-walled (Elser, et al. 2024), you can read a concise description of their work in this November, 2024 Research Highlight by the NIH National Institute on Aging, by Brian Doctrow, PhD. In a nutshell, among 1.2 million Californians aged 60+, there did seem to be a connection between neighborhood wildfire PM2.5 exposure and dementia diagnosis, which was considerably stronger than the connection with other types of fine particulate exposure. For every 1 μg/m3 increase in average wildfire PM2.5, the odds of receiving a dementia diagnosis increased by 18%.
Matsu engine protecting Nenana during the Parks Highway fire, 2006 (Photo: State of Alaska, DNR).
Download the latest Roundup with brief highlights of new publications that may interest the Alaska fire science and management community HERE. The fall Roundup includes links to articles on improvements in ranking fire risk around communities and structures, new findings on changes in fire regime in Alaska and Canada, implications of increases in high latitude fire on the atmosphere, and interesting findings on toxic components in fire retardant chemicals. Here’s the URL to a downloadable version:
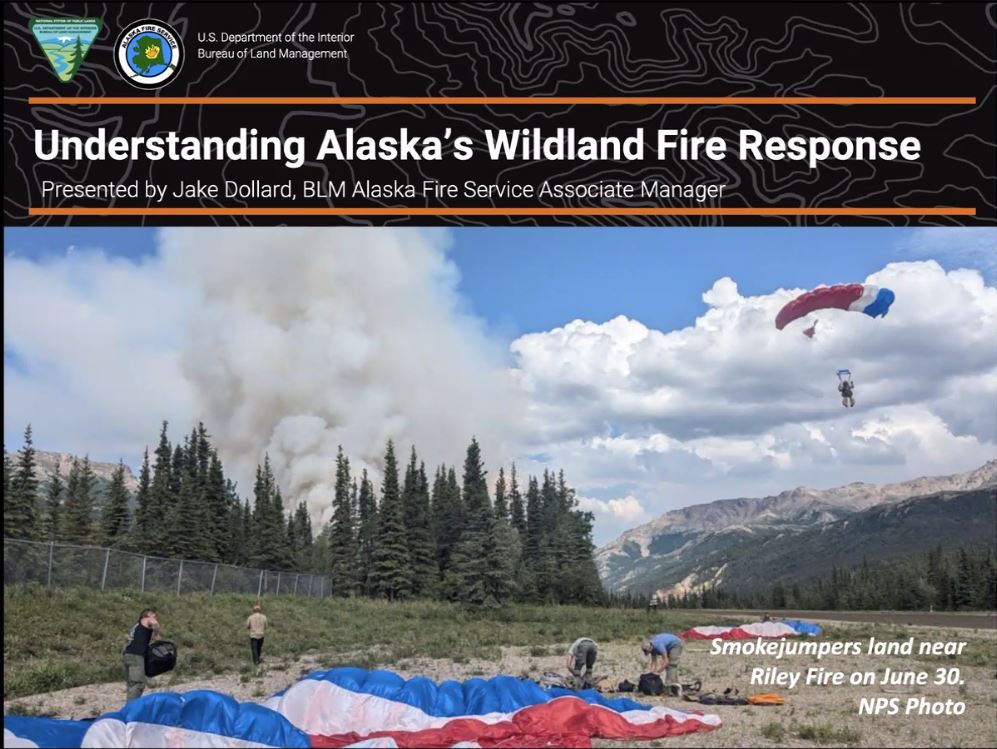
Also, if you missed this webinar, be sure to check out the recorded presentation “Spark to Strategy“–by Rick Thoman (ACCAP) and Jake Dollard (Alaska Fire Service) on the 2024 fire season and how fire management plans turn into actions in Alaska.
Caribou lichens, Cladonia (Cladina) spp., are a slow-growing, vital winter forage for caribou. They are commonly called “reindeer moss” but aren’t really moss. And they are important to both reindeer and to caribou. Eric Palm (2022), for his PhD thesis, used GPS-collared caribou locations from several agencies in Alaska to show that caribou strongly avoided burned areas, especially in winter, and that their preference was related to lichen abundance. He concluded that: “caribou will experience increasing winter habitat loss as fire frequency and severity increase [in a warmer climate]. . . .We suggest that management strategies prioritizing protection of core winter range . . . would provide important climate-change refugia for caribou.” In a separate study, Matt Macander et al. (2020) demonstrated effective satellite mapping of lichen-rich ranges in Alaska, and his analyses also reinforced the caribou preference for habitat areas with >30% lichen cover.
Often you hear that lichens are only important in winter, but Libby Ehler (2021) used GPS video collars as well as diet analysis from droppings to show that lichens dominated caribou summer diet for the Alaska Fortymile Herd: 59% of composition of fecal pellets and 39% of observed foraging on the video collars in summer was lichen (vs. 37% shrubs). Only in June and July did the videos record a little more browsing on shrub than lichen, and in winter caribou expend a lot of energy locating and digging for rich patches of ground-hugging lichens. Previous studies demonstrated similar diet dominance by lichens in other herds in Alaska and Canada.
Now, in a new study, Liming He, of Natural Resources Canada, has documented large-scale decline in these lichen habitats in Eastern Canada. His study derived caribou lichen cover maps for two time periods ~30 years apart (1980’s, & 2020’s) using Landsat satellite imagery for a large area including several boreal caribou population ranges. Lichen cover declined in 62% of the region evaluated and increased in 11%. Fires were responsible for a quarter of the decrease, even in a region of Canada where fires have been relatively rare. The larger part (3/4) remains unexplained, with warming-induced shrub encroachment high on the list of suspects. Although we do not yet have a comparable study for Alaska, Macander et al. (2022) found lichen had declined 13% as a plant functional type in Alaska from 1985-2020, in a study that also used Landsat satellite data.
Taken together, these studies should alert wildlife and land managers about a possible habitat crisis on the horizon for Alaska’s 2nd largest subsistence resource. Indeed, most caribou herds across North America are experiencing declines, including the Western Arctic Caribou herd—once Alaska’s largest—featured in a recent Alaska Beacon article. The George River Caribou Herd in eastern Canada was the world’s largest in the 1990’s (800,000 animals) but by 2022 was down to just 7,200. Part of that herd’s decline is thought to be based on habitat degradation from overuse.